Tell your data story
with expert data visualization UX
At Selma Digital, we create compelling visualizations that simplify data complexity and tell a data story.
As data visualization UX experts, we partner with our clients to help their viewers interact with data in meaningful ways.
Ready to learn how Selma Digital can help?
Email us at srswire@selma.digital
GET IN TOUCH
to discuss how we can elevate your data with expert visualization UX solutions.

ABOUT OUR NYC design STUDIO
AWARD-WINNING
UX DESIGN
FINTECH & SAAS
DATA EXPERTISE
DATA STORIES
FOR B2B & B2C
FEMALE-LED
INNOVATION STUDIO
Why invest in data
visualization UX?
We live in an age where there is an excess of data. How we use this data, and how we communicate to each other with the data, is key to unlocking its potential. When companies invest in data visualization UX, they open doors for people to make quicker, more informed decisions. Clear, intuitive visuals help people easily understand information. A more thorough understanding can lead to increased productivity, new insights, general reduction in errors, or even a more positive impression of the product overall. Data visualization UX can help increase the value of your offering, helping your business to grow and thrive.

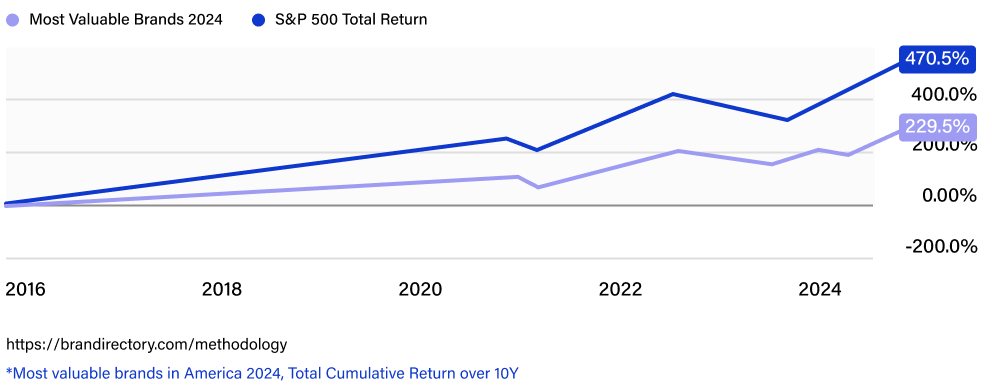
When companies invest in their brand and digital experience, value grew 207%
more than the S&P 500 over a 10-year period.*
DATA VISUALIZATION UX
We break down the process
into discreet steps, ensuring that every
project delivers value:
At Selma Digital, our approach is tailored to the needs of your business, industry, and customer base. Propelling your organization towards growth is our north star.

1. Plan
We define project goals collaboratively with our clients, understanding the context of the project and expected outcomes. Typical outputs during this phase include interviews, data cleaning and organization, brand analysis.

2. Frame
We use audience and competitive research to ground our plans in the real world and unearth user insights.

3. Design
Functional design specifications, assets, and documentation are delivered to stakeholders and technology teams. During development, we support your team to ensure that the user experience is fully realized.

4. Optimize
Before we finalize our concepts, we validate them one more time through soft launches and further user testing.

5. Deliver
Functional design specifications, assets, and documentation are delivered to stakeholders and technology teams. During development, we support your team to ensure that the user experience is fully realized.

6. Scale
We partner with you to help your digital ecosystem grow along with your business, platforms, or customer base.
OUR PROCESS
Industry-specific techniques designed
to speak directly to your audience
Each audience segment has unique expectations for data visualization. Our experts use targeted visual methods to communicate your data to your your customer.
Data Visualization UX to Drive Actionable Insights
When it comes to B2B or fintech products, effective data visualization is more than just charts and graphs—it's about providing clarity that empowers decision-making. It’s about speed from awareness to execution. At Selma Digital, we specialize in Data Visualization UX, helping your users extract meaningful insights from complex data sets, then easily take action on that data. Our deep understanding of data visualization techniques ensures you’re communicating information accurately and effectively, ultimately driving growth.
Data Visualization UX to Create Awareness
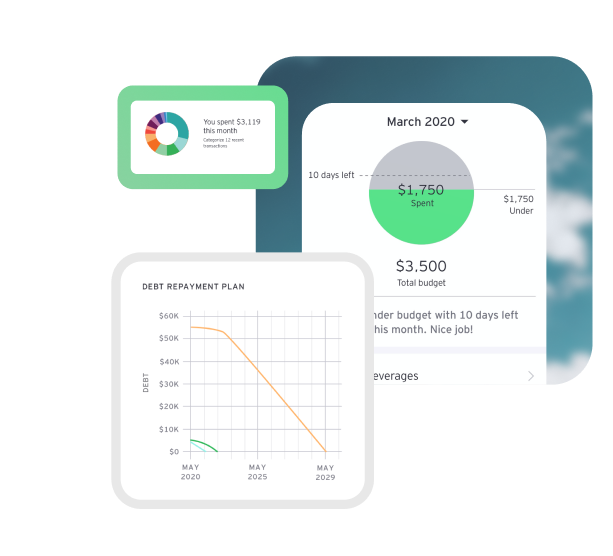
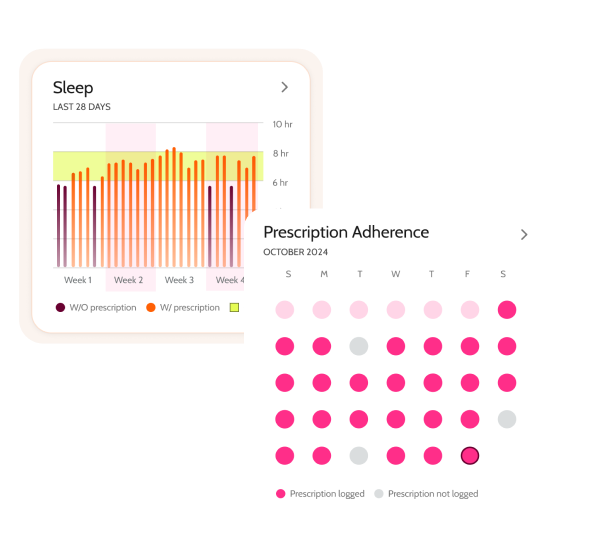
Data visualizations that are designed for the everyday consumer with personal needs and goals take a different approach than those used in business dashboards. Legibility, cognitive load, communication, and psychological context are all important considerations in data visualization UX. The goal with these types of visualizations is to help a person create awareness and make change in their life through understanding their personal data. Our tailored design approach ensures that your data visualizations will have the appropriate touch for the individual customer.
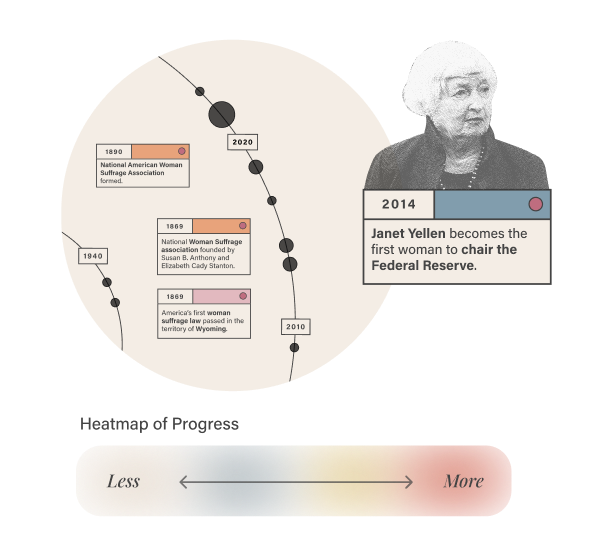
Data Visualization UX to Tell a Story
At Selma Digital, we leverage our data visualization skills as creative communicators, transforming your data into a digital narrative experience. From concept to deployment, we collaborate closely with your team to create story-driven data experiences that resonate with your audience. Let us transform your data into a valuable communication tool that helps your story stand out.
Designing technology
with data in mind
When your organization’s communications or operations rely on data, visualization is paramount.
With our extensive knowledge of both data visualization, UX design, and technology, you can feel confident that Selma Digital will define and execute the right solution for your business needs.
Schedule a call to discuss how we can elevate your data visualization UX and customer experience.
SCHEDULE A CALLFROM OUR CLIENTS
Read all of our reviews on Clutch
"Selma Digital goes above and beyond to ensure the designs fit within our website and overall workflow. They do the extra work to make sure that what they’re producing fits well within our market."
“They’re easy to work with and committed to doing the job correctly.”
"The overall design of our site and brand is amazing and receiving rave reviews from employees and customers. Selma Digital constantly put our needs and wants first and offered helpful guidance when needed."
"Selma-Rachel and her team mapped out the project from day 1. It was an excellent balance of design, brainstorm oriented meetings and operationally focused, deliverables meetings... Overall the team just went above and beyond. I can't recommend Selma Digital enough."
"We get compliments nearly every day about how beautiful our website is... Selma Digital is honest and offer great insight... They had a strong vision for our company. "

Frequently asked questions:
How do you handle large or complex data sets?
Depending on the communication goals, we study the meaning of the data sets and learn from SME's to ensure we're designing the data in ways that add clarity and present new views.
How involved does my team need to be?
Yes, we work with our clients to elevate their existing dashboards and tools, redesigning them to improve user experience and aesthetic appeal.
Can you redesign our existing dashboards or tools?
We have extensive experience in finance, health, SaaS, media, and communications.
What industries do you specialize in?
Yes! We are design consultants, and we try to match processes and methods to best meet the needs of our client’s businesses. Whether we’re doing experience design, branding, visual design, or design strategy, we generally go through the same process, but may perform different tasks in each phase depending on the project.
First, we get to know you, your business, your audience, your needs, your team. We empathize with the audience, performing various research tasks to best hypothesize their pain points and needs. This helps us frame the project and further define the best plan of action.
Next, we ideate with you and your team. Whether we’re writing scenarios for a new product or enhancement, or creating moodboards for a new brand and website aesthetic, we look at options and play with ideas to come up with creative solutions. We may pick a direction together, edit, refine, do some user testing or preference testing, and edit again.
Finally, we document our solutions, preparing for use by your technology team or marketing team. We support with design QA in the development process, and support efforts to further aid in adoption and scale.
Can you explain your overall design process a little more?
Projects range in length, typically from 4 weeks to 6+ months. The length of the process depends on the size and scope of the project. If you have a launch date in mind, we ensure the project is scoped to meet the launch.