
Financial research & presentation platform
YCharts is a comprehensive research and proposal creation platform for finance professionals.
In 2017, YCharts and Selma Digital began working together to update the look and feel of the suite of YCharts apps while also creating a responsive framework. What started as a rebranding and UI project extended into a 7+ year partnership between Selma Digital and YCharts, with Selma Digital serving as their Agency of Record for digital product design.
What was the process to update the look and feel of YCharts?
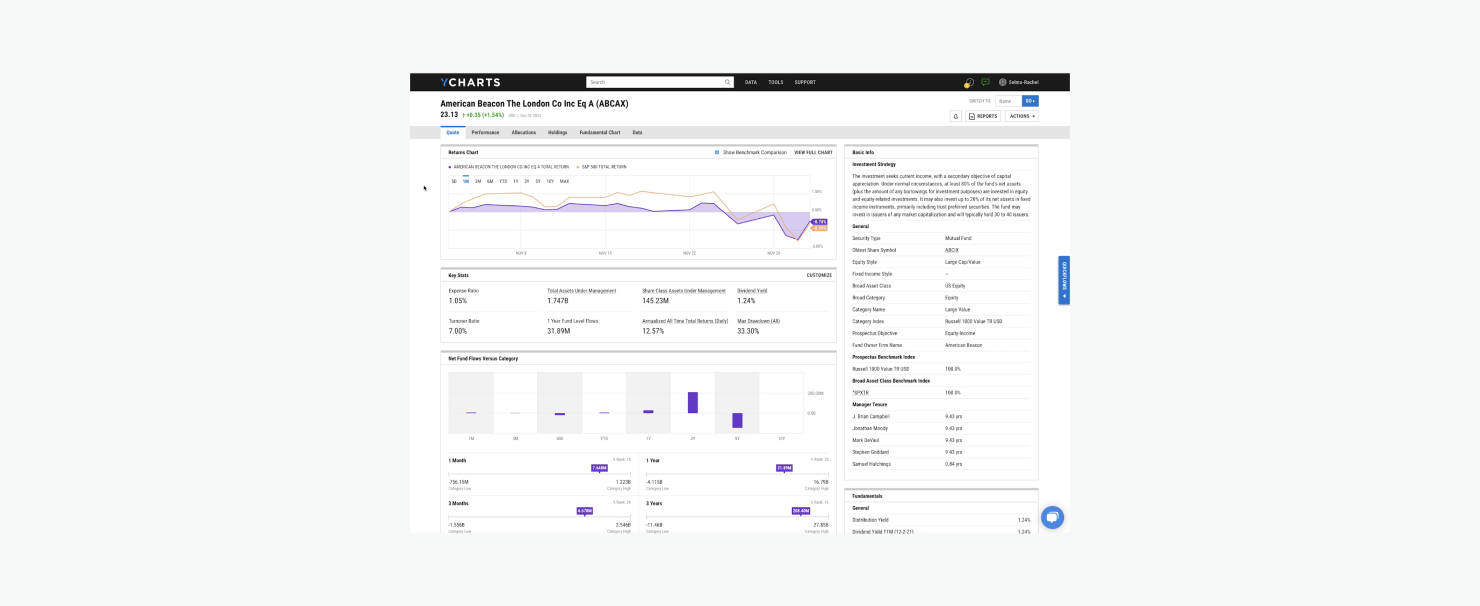
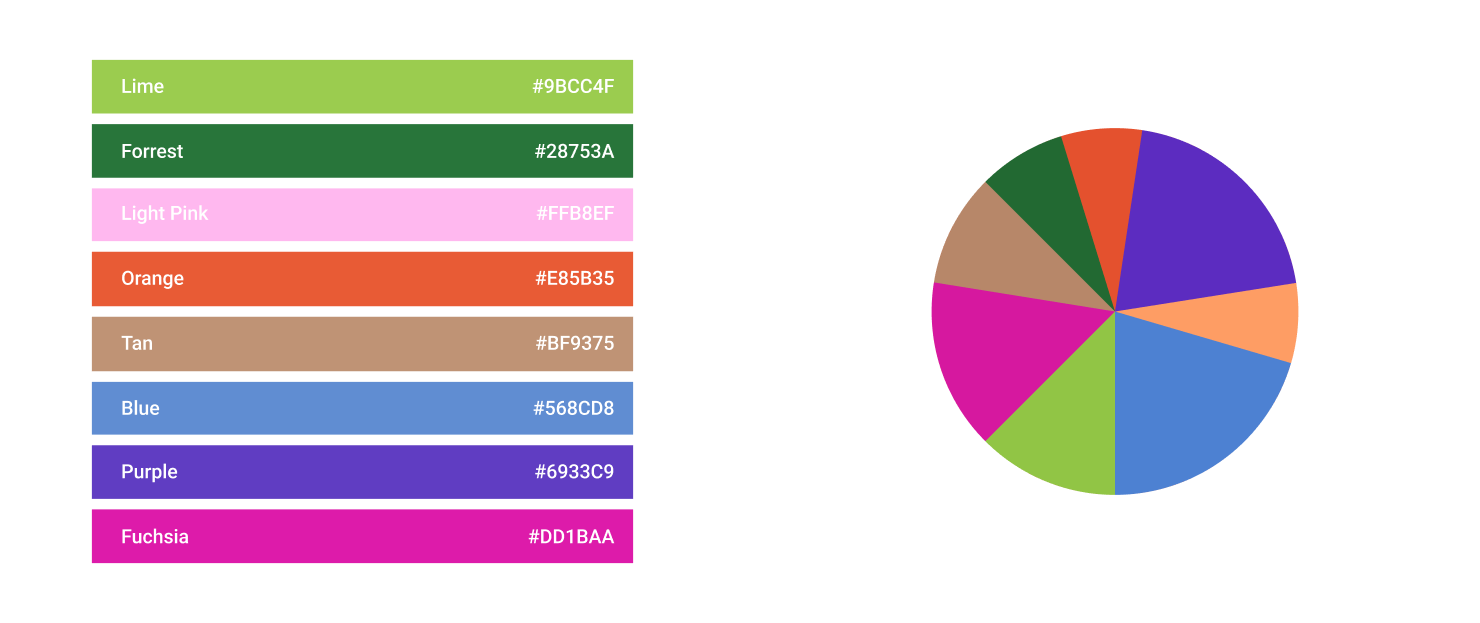
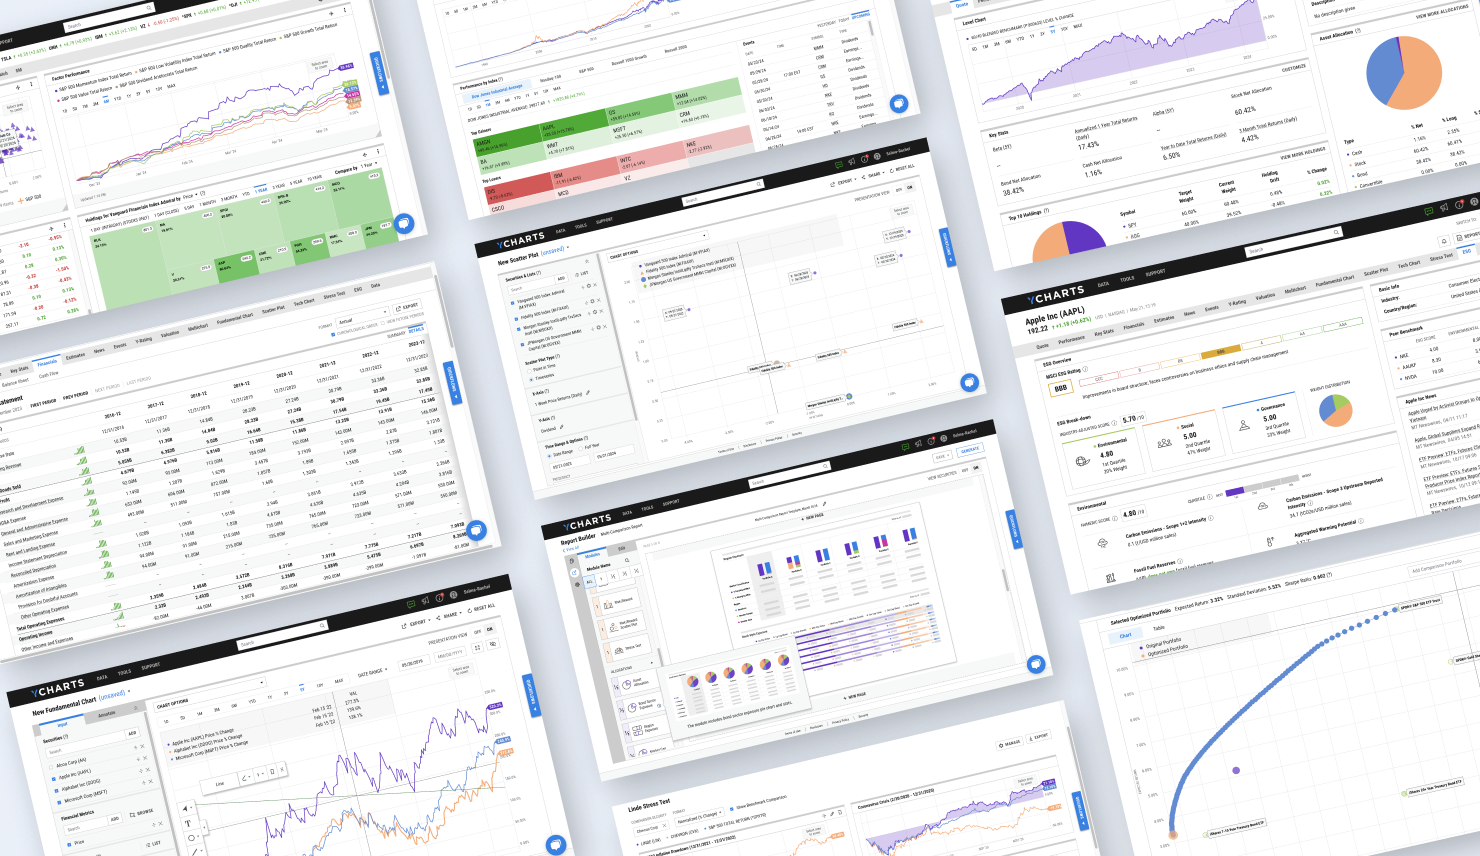
Initially, we met with key stakeholders to understand the brand essence, while also delving deep into the competitive landscape. Through a series of exercises and workshops, we defined the brand pillars and values. The key words in the brand pillars and values created a framework that we could translate into a visual design for the product. After some exploration and experimentation, we decided on a simple yet modern aesthetic with an updated color palette that stood out from competitors. The font Roboto Condensed was used to best accommodate tabular data and data density. Charts and graphs were updated to be legible and minimalist, letting the data take center stage.
They constantly put our needs and wants first and offered helpful guidance when needed.”
Director, YCharts
![]()
How have you evolved the product suite as YCharts has grown its product suite?
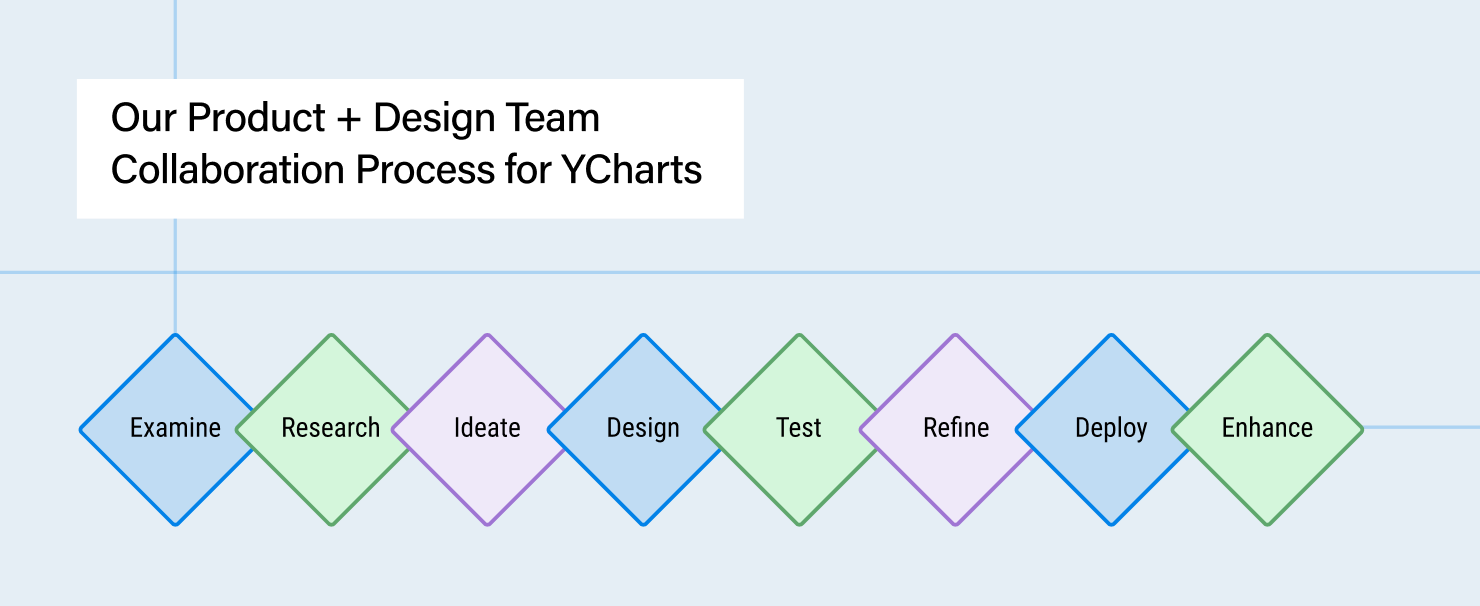
We collaborate with the team across all phases of the product life cycle, from concept development through design iteration, user testing, and collaboration with engineering and QA. We strive to develop innovative approaches to the UX while maintaining a consistent experience throughout the entire application, broadening our user base while maintaining our core audience and services.
We ensure we stay aligned with the product strategy by studying the industry and fully understanding customer needs, expectations, and world views. We ensure we incorporate similar UX patterns throughout the site, even as applications evolve. Additionally, we always look for opportunities to connect the different research applications and tools to make the overall experience more valuable and intuitive.
How do you tie together separate workflows to create a cohesive product experience?
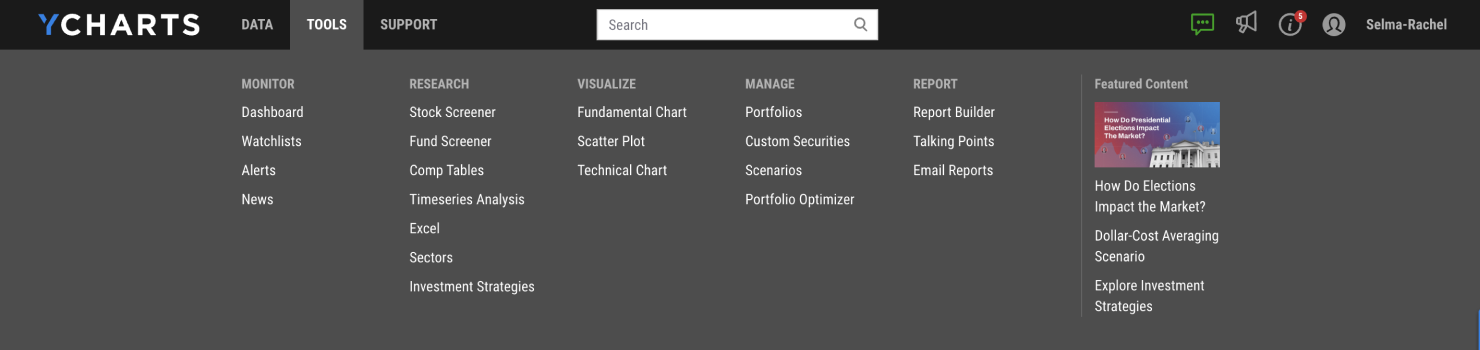
Being consistent with affordances, interactions, and placement helps unify the experience overall. Documentation of UX, UI, and IA patterns is extremely important, while also documenting the rationale behind decisions in order to provide context to the larger team.
Creating interaction patterns and ensuring different applications follow similar patterns helps users onboard to different applications easily. Looking for opportunities to unify the apps is important. By making it simple and easy to switch modes or visualize data from different tools, the experience transforms into a holistic system of easy-to-use workflows.

